
 |
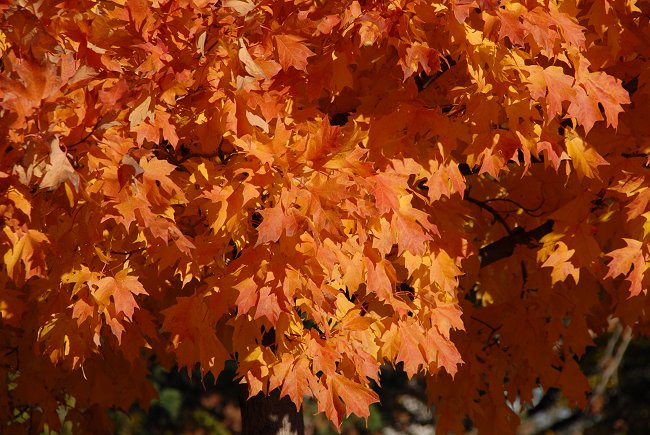 |
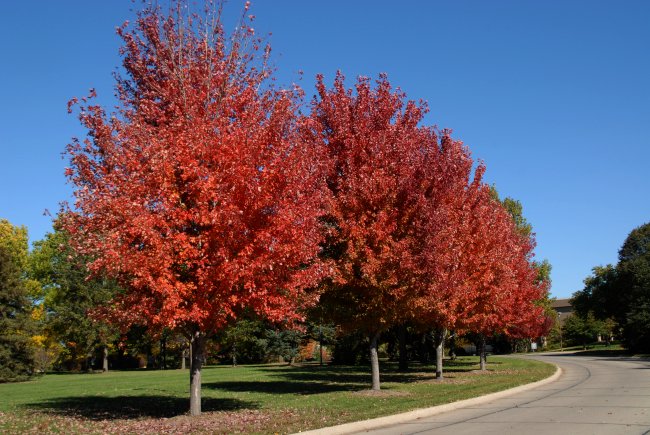
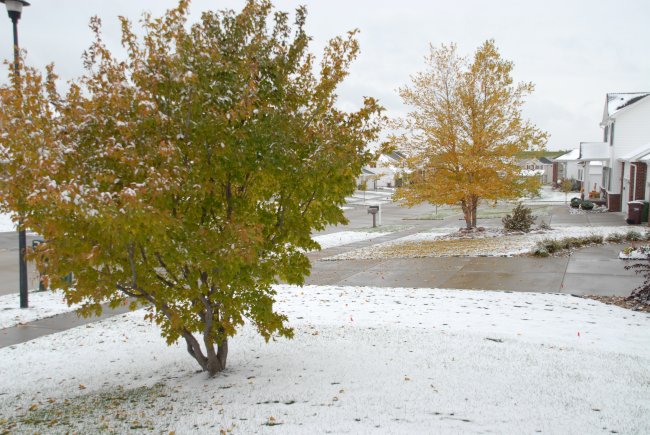
| Autumn Colors Gallery 2009 One | Autumn Colors Gallery 2009 Two |
LAST MONTH: September 2009 Lincoln Data
Climate News:
Year 2009 Precipitation (in inches)
Compared to Normal (RED is above normal and
BLUE is below normal)
JAN
FEB
MAR
APR
MAY
JUN
JUL
AUG
SEP
OCT
NOV
DEC
TOTAL
2009
0.38
0.64
0.18
1.52
1.17
6.18
1.84
3.20
1.25
4.24
.
.
20.60
NORMAL
0.67
0.66
2.21
2.9
4.23
3.51
3.54
3.35
2.92
1.94
1.58
0.86
28.37
|
October 1-31, 2009 is the 2nd coldest on record (123 years of data) Lowest Average Temperature degrees F; Days: 10/1 - 10/31, Years: 1887-2009 Rank Value Ending Date 1 42.8 10/31/1925 2 46.2 10/31/2009 3 46.5 10/31/1917 4 46.7 10/31/2002 5 47.2 10/31/1976 6 48.4 10/31/1987 7 49.0 10/31/1972 8 49.7 10/31/1898 9 50.0 10/31/1887 10 50.1 10/31/1919 |
October 2009 precipitation, 12th wettest on record (123 years of data) Highest Total Precipitation inches Days: 10/1 - 10/31, Years: 1887-2009 Rank Value Ending Date 1 5.40 10/31/1986 2 5.29 10/31/1979 3 4.92 10/31/1973 4 4.90 10/31/2002 5 4.82 10/31/1891 6 4.80 10/31/1918 7 4.79 10/31/2008 8 4.57 10/31/1929 9 4.50 10/31/2007 10 4.36 10/31/1957 11 4.29 10/31/1971 12 4.24 10/31/2009 |
| October | 2009 | MAX | MIN | MEAN | DEP | PCPN | REC | REC | REC | HDD | CDD | AVG | AVG | AVG | Snow |
| PREC | MAX | MIN | MAX | MIN | Mean | ||||||||||
| Thursday | Oct. 1 | 67 | 50 | 59 | -1 | 0.02 | 1.65 | 94 | 27 | 6 | 0 | 74 | 47 | 60 | |
| Friday | Oct. 2 | 55 | 46 | 51 | -9 | T | 1.28 | 94 | 28 | 14 | 0 | 73 | 46 | 60 | |
| Saturday | Oct. 3 | 59 | 32 | 46 | -13 | 0.00 | 2.10 | 96 | 27 | 19 | 0 | 73 | 46 | 59 | |
| Sunday | Oct. 4 | 62 | 29 | 46 | -13 | 0.00 | 1.20 | 93 | 29 | 19 | 0 | 72 | 46 | 59 | |
| Monday | Oct. 5 | 66 | 46 | 56 | -3 | 0.42 | 0.89 | 98 | 28 | 9 | 0 | 72 | 45 | 59 | |
| Tuesday | Oct. 6 | 56 | 34 | 45 | -13 | 0.06 | 1.01 | 93 | 24 | 20 | 0 | 72 | 45 | 58 | |
| Wednesday | Oct. 7 | 73 | 33 | 53 | -5 | 0.00 | 1.18 | 90 | 20 | 12 | 0 | 71 | 44 | 58 | |
| Thursday | Oct. 8 | 53 | 41 | 47 | -10 | 0.08 | 1.79 | 90 | 17 | 18 | 0 | 71 | 44 | 57 | |
| Friday | Oct. 9 | 55 | 33 | 44 | -13 | T | 1.73 | 90 | 18 | 21 | 0 | 70 | 43 | 57 | |
| Saturday | Oct. 10 | 38 | 27 | 33 | -23 | 0.09 | 2.26 | 91 | 24 | 32 | 0 | 70 | 43 | 56 | 1.2 |
| Sunday | Oct. 11 | 40 | 32 | 36 | -20 | T | 2.74 | 89 | 21 | 29 | 0 | 69 | 43 | 56 | |
| Monday | Oct. 12 | 44 | 32 | 38 | -18 | 0.03 | 2.59 | 93 | 21 | 27 | 0 | 69 | 42 | 56 | T |
| Tuesday | Oct. 13 | 45 | 35 | 40 | -15 | 0.16 | 1.13 | 92 | 22 | 25 | 0 | 68 | 42 | 55 | |
| Wednesday | Oct. 14 | 42 | 38 | 40 | -15 | 0.05 | 0.86 | 91 | 24 | 25 | 0 | 68 | 41 | 55 | |
| Thursday | Oct. 15 | 50 | 39 | 45 | -9 | 0.00 | 1.12 | 91 | 22 | 20 | 0 | 67 | 41 | 54 | |
| Friday | Oct. 16 | 51 | 38 | 45 | -9 | T | 1.74 | 88 | 21 | 20 | 0 | 67 | 40 | 54 | |
| Saturday | Oct. 17 | 50 | 33 | 42 | -11 | 0.00 | 1.18 | 85 | 15 | 23 | 0 | 66 | 40 | 53 | |
| Sunday | Oct. 18 | 68 | 34 | 51 | -2 | 0.00 | 1.27 | 87 | 21 | 14 | 0 | 66 | 40 | 53 | |
| Monday | Oct. 19 | 72 | 45 | 59 | +7 | 0.00 | 1.02 | 88 | 12 | 6 | 0 | 65 | 39 | 52 | |
| Tuesday | Oct. 20 | 65 | 50 | 58 | +6 | T | 0.46 | 90 | 18 | 7 | 0 | 65 | 39 | 52 | |
| Wednesday | Oct. 21 | 63 | 44 | 54 | +3 | 0.54 | 0.75 | 89 | 20 | 11 | 0 | 64 | 38 | 51 | |
| Thursday | Oct. 22 | 44 | 35 | 40 | -11 | 1.38 | 2.01 | 89 | 19 | 25 | 0 | 64 | 38 | 51 | T |
| Friday | Oct. 23 | 51 | 32 | 42 | -8 | 0.01 | 1.18 | 84 | 20 | 23 | 0 | 63 | 37 | 50 | |
| Saturday | Oct. 24 | 58 | 29 | 44 | -6 | T | 0.85 | 89 | 17 | 21 | 0 | 62 | 37 | 50 | |
| Sunday | Oct. 25 | 56 | 36 | 46 | -3 | T | 2.19 | 89 | 15 | 19 | 0 | 62 | 36 | 49 | |
| Monday | Oct. 26 | 56 | 26 | 41 | -8 | T | 1.57 | 86 | 19 | 24 | 0 | 61 | 36 | 49 | |
| Tuesday | Oct. 27 | 60 | 28 | 44 | -4 | 0.00 | 0.97 | 89 | 8 | 21 | 0 | 61 | 36 | 48 | |
| Wednesday | Oct. 28 | 60 | 45 | 53 | +5 | 0.00 | 1.56 | 84 | 10 | 12 | 0 | 60 | 35 | 48 | |
| Thursday | Oct. 29 | 58 | 47 | 53 | +6 | 1.38 | 1.98 | 87 | 9 | 21 | 0 | 59 | 35 | 47 | |
| Friday | Oct. 30 | 49 | 38 | 44 | -3 | 0.02 | 4.07 | 83 | 3 | 21 | 0 | 59 | 34 | 47 | |
| Saturday | Oct. 31 | 62 | 30 | 46 | 0 | 0.00 | 2.07 | 83 | 11 | 19 | 0 | 58 | 34 | 46 | |
| TOTAL | 4.24 | 574 | 0 | 1.2 | |||||||||||
| Average | 55.7 | 36.7 | 46.2 | ||||||||||||
| Normal | 66.5 | 40.4 | 53.5 | 1.94 | 377 | 12 | 0.7 | ||||||||
| Departure | -10.8 | -3.7 | -7.3 | +2.30 | -197 | -12 | |||||||||
| October | 2009 | MAX | MIN | MEAN | DEP | PCPN | REC | REC | REC | HDD | CDD | AVG | AVG | AVG | Snow |
| PREC | MAX | MIN | MAX | MIN | Mean |

| AVERAGE AND TOTAL are OCTOBER 2009.
NORMAL (Norm) is the 1971-2000 Standard normal. MAX = Observed Maximum and MIN = Observed Minimum temperatures. MEAN = Observed Mean Daily temperature. DEP = DEPARTURE is OCTOBER 2009 Average measured against 1971-2000 normals. PCPN = Observed daily precipitation (midnight to midnight, CST). REC PREC = Record daily precipitation amount for the day REC MAX = Record maximum temperature. REC MIN = Record Minimum temperature. HDD = heating degree day units (base of 65 degrees). CDD = cooling degree day units (base of 65 degrees). AVG MAX = Daily Normal High Temperature (1971-2000 normals). AVG MIN = Daily Normal Low Temperature (1971-2000 normals). AVG MEAN = Daily Normal Mean Temperature (1971-2000 normals). |
|
University of Nebraska-Lincoln Applied Climate Science School of Natural Resources |