Lincoln, Nebraska 100 F Climatology: 1887-2010 (124
years)
CONTENTS OF THIS PAGE:
Daily frequency of days with highs 100 F or warmer
Annual frequency of days with highs 100 F or warmer
Table listing the years with the most annual total of days 100 F or warmer
Table listing the longest continuous stretch of days 100 F or warmer
Table listing the monthly total of days 100 F or warmer, 1887 to present
Table Listing the daily frequency of days with highs 100 F or warmer
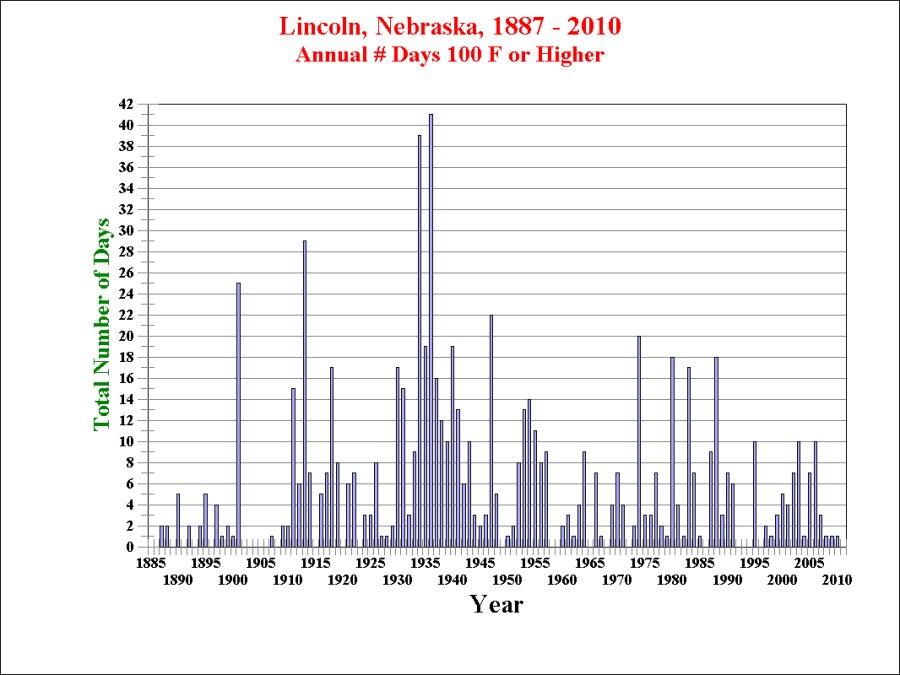
The
years with the most total number of days
with the
temperature 100 degrees F
or higher
for Lincoln, NE.
| YEAR
|
NUMBER OF
DAYS
|
RANK
|
| 1936
|
41
|
1
|
| 1934
|
39
|
2
|
| 1913
|
29
|
3
|
| 1901
|
25
|
4
|
| 1947
|
22
|
5
|
| 1974
|
20
|
6
|
| 1935
|
19
|
7
|
| 1940
|
19
|
8
|
| 1980
|
18
|
9
|
| 1988
|
18
|
10
|
YEAR
2010: 1 DAY (August 12);
YEAR 2009 1 Day (August 8 )
Normal annual total is 5
days
The
Longest continuous stretch with days
100
degrees F or higher for Lincoln, NE.
| DATES
|
NUMBER OF
100 Degree DAYS
|
RANK
|
| 7/11/1934
-- 7/25/1934 |
15
|
1
|
| 7/
9/1936 -- 7/19/1936 |
11
|
2
|
| 7/
8/1901 -- 7/17/1901 |
10
|
3
|
|
7/19/1901 -- 7/27/1901 |
9
|
4
|
|
6/18/1988 -- 6/25/1988 |
8
|
4
|
|
8/11/1936 -- 8/18/1936 |
8
|
6
|
|
6/29/1911 -- 7/05/1911 |
7
|
5
|
|
7/26/1935 -- 8/01/1935 |
7
|
5
|
| 7/
6/1980 -- 7/11/1980 |
6
|
7
|
|
7/13/1913 -- 7/17/1913 |
5
|
8
|
|
7/27/1917 -- 7/31/1917 |
5
|
8
|
|
6/15/1918 -- 6/19/1918 |
5
|
8
|
|
7/7/1930 -- 7/11/1930 |
5
|
8
|
|
7/16/1930 -- 7/20/1930 |
5
|
8
|
| 7/
2/1936 -- 7/26/1936 |
5
|
8
|
| 7/
23/1936 -- 8/27/1936 |
5
|
8
|
|
7/21/1941 -- 7/25/1941 |
5
|
8
|
|
8/1/1947 -- 8/5/1947 |
5
|
8
|
|
8/16/1947 -- 8/20/1947 |
5
|
8
|
| 7/
9/1966 -- 7/13/1966 |
5
|
8
|
|
7/17/1974 -- 7/21/1974 |
5
|
8
|
|
7/18/1983 -- 7/22/1983 |
5
|
8
|
|
7/29/1987 -- 8/2/1987 |
5
|
8
|
|
7/10/1995 -- 7/14/1995 |
5
|
8
|
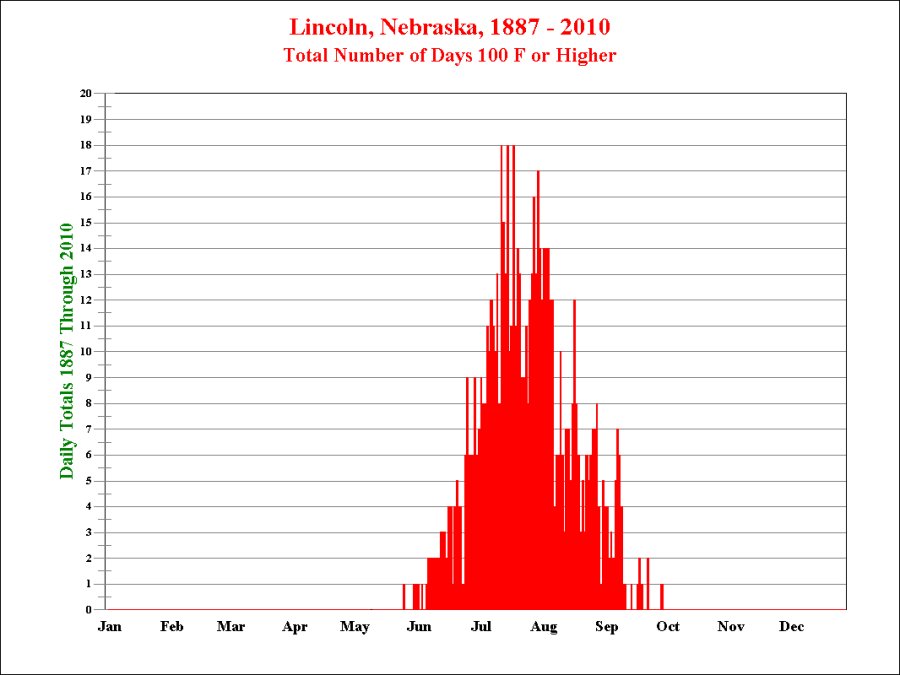
Lincoln, Nebraska
Total Daily
Occurrences of Temperatures 100 F or Higher,
1887 through
2010 (124 years)
| Day |
Jan |
Feb |
Mar |
Apr |
May |
Jun |
Jul |
Aug |
Sep |
Oct |
Nov |
Dec |
Day |
| 1 |
0 |
0 |
0 |
0 |
0 |
0 |
9 |
14 |
4 |
0 |
0 |
0 |
1 |
| 2 |
0 |
0 |
0 |
0 |
0 |
1 |
8 |
14 |
2 |
0 |
0 |
0 |
2 |
| 3 |
0 |
0 |
0 |
0 |
0 |
0 |
8 |
14 |
3 |
0 |
0 |
0 |
3 |
| 4 |
0 |
0 |
0 |
0 |
0 |
1 |
11 |
12 |
2 |
0 |
0 |
0 |
4 |
| 5 |
0 |
0 |
0 |
0 |
0 |
2 |
10 |
12 |
5 |
0 |
0 |
0 |
5 |
| 6 |
0 |
0 |
0 |
0 |
0 |
2 |
12 |
4 |
7 |
0 |
0 |
0 |
6 |
| 7 |
0 |
0 |
0 |
0 |
0 |
2 |
11 |
6 |
6 |
0 |
0 |
0 |
7 |
| 8 |
0 |
0 |
0 |
0 |
0 |
2 |
10 |
6 |
4 |
0 |
0 |
0 |
8 |
| 9 |
0 |
0 |
0 |
0 |
0 |
2 |
13 |
10 |
1 |
0 |
0 |
0 |
9 |
| 10 |
0 |
0 |
0 |
0 |
0 |
2 |
8 |
6 |
1 |
0 |
0 |
0 |
10 |
| 11 |
0 |
0 |
0 |
0 |
0 |
3 |
18 |
3 |
0 |
0 |
0 |
0 |
11 |
| 12 |
0 |
0 |
0 |
0 |
0 |
3 |
15 |
8 |
0 |
0 |
0 |
0 |
12 |
| 13 |
0 |
0 |
0 |
0 |
0 |
3 |
13 |
7 |
1 |
0 |
0 |
0 |
13 |
| 14 |
0 |
0 |
0 |
0 |
0 |
2 |
18 |
5 |
0 |
0 |
0 |
0 |
14 |
| 15 |
0 |
0 |
0 |
0 |
0 |
4 |
10 |
8 |
0 |
0 |
0 |
0 |
15 |
| 16 |
0 |
0 |
0 |
0 |
0 |
4 |
11 |
12 |
1 |
0 |
0 |
0 |
16 |
| 17 |
0 |
0 |
0 |
0 |
0 |
1 |
18 |
8 |
2 |
0 |
0 |
0 |
17 |
| 18 |
0 |
0 |
0 |
0 |
0 |
4 |
11 |
6 |
1 |
0 |
0 |
0 |
18 |
| 19 |
0 |
0 |
0 |
0 |
0 |
5 |
14 |
3 |
0 |
0 |
0 |
0 |
19 |
| 20 |
0 |
0 |
0 |
0 |
0 |
4 |
13 |
5 |
0 |
0 |
0 |
0 |
20 |
| 21 |
0 |
0 |
0 |
0 |
0 |
4 |
9 |
3 |
2 |
0 |
0 |
0 |
21 |
| 22 |
0 |
0 |
0 |
0 |
0 |
1 |
9 |
6 |
0 |
0 |
0 |
0 |
22 |
| 23 |
0 |
0 |
0 |
0 |
0 |
6 |
11 |
5 |
0 |
0 |
0 |
0 |
23 |
| 24 |
0 |
0 |
0 |
0 |
1 |
9 |
8 |
6 |
0 |
0 |
0 |
0 |
24 |
| 25 |
0 |
0 |
0 |
0 |
0 |
6 |
12 |
7 |
0 |
0 |
0 |
0 |
25 |
| 26 |
0 |
0 |
0 |
0 |
0 |
6 |
13 |
7 |
0 |
0 |
0 |
0 |
26 |
| 27 |
0 |
0 |
0 |
0 |
0 |
6 |
16 |
8 |
0 |
0 |
0 |
0 |
27 |
| 28 |
0 |
0 |
0 |
0 |
0 |
9 |
13 |
4 |
1 |
0 |
0 |
0 |
28 |
| 29 |
0 |
0 |
0 |
0 |
1 |
6 |
17 |
1 |
0 |
0 |
0 |
0 |
29 |
| 30 |
0 |
- |
0 |
0 |
1 |
7 |
14 |
5 |
0 |
0 |
0 |
0 |
30 |
| 31 |
0 |
- |
0 |
- |
1 |
- |
12 |
4 |
- |
0 |
- |
0 |
31 |
The calendar day
with the most occurrences of temperatures 100 F or higher is
July 11, 14 and
17 with 18 occurrences out of 124 years (14.5% of all possible occurrences).
Lincoln,
NE, 1887 to 2010
Monthly
and Annual Totals of Days with Temperature 100 F or Higher
| Year
|
May
Number of days
|
Jun
Number of days
|
July
Number of days
|
August
Number of days
|
Sept.
Number of days
|
Annual
Number of days
|
| 2010 |
0
|
0
|
0
|
1
|
0
|
1
|
| 2009 |
0
|
0
|
0
|
1
|
0
|
1
|
| 2008 |
0
|
0
|
0
|
1
|
0
|
1
|
| 2007
|
0
|
0
|
2
|
1
|
0
|
3
|
| 2006
|
0
|
1
|
6
|
3
|
0
|
10
|
| 2005
|
0
|
0
|
6
|
0
|
1
|
7
|
| 2004
|
0
|
0
|
0
|
1
|
0
|
1
|
| 2003
|
0
|
0
|
5
|
5
|
0
|
10
|
| 2002
|
0
|
0
|
4
|
3
|
0
|
7
|
| 2001
|
0
|
0
|
2
|
2
|
0
|
4
|
| 2000
|
0
|
0
|
0
|
4
|
1
|
5
|
| 1999
|
0
|
0
|
3
|
0
|
0
|
3
|
| 1998
|
0
|
0
|
1
|
0
|
0
|
1
|
| 1997
|
0
|
0
|
2
|
0
|
0
|
2
|
| 1996
|
0
|
0
|
0
|
0
|
0
|
0
|
| 1995
|
0
|
0
|
7
|
3
|
0
|
10
|
| 1994
|
0
|
0
|
0
|
0
|
0
|
0
|
| 1993
|
0
|
0
|
0
|
0
|
0
|
0
|
| 1992
|
0
|
0
|
0
|
0
|
0
|
0
|
| 1991
|
0
|
0
|
4
|
2
|
0
|
6
|
| 1990
|
0
|
1
|
4
|
2
|
0
|
7
|
| 1989
|
0
|
1
|
1
|
1
|
0
|
3
|
| 1988
|
0
|
9
|
3
|
6
|
0
|
18
|
| 1987
|
0
|
4
|
3
|
2
|
0
|
9
|
| 1986
|
0
|
0
|
0
|
0
|
0
|
0
|
| 1985
|
0
|
0
|
0
|
1
|
0
|
1
|
| 1984
|
0
|
0
|
3
|
3
|
1
|
7
|
| 1983
|
0
|
0
|
6
|
10
|
1
|
17
|
| 1982
|
0
|
0
|
0
|
1
|
0
|
1
|
| 1981
|
0
|
0
|
4
|
0
|
0
|
4
|
| 1980
|
0
|
2
|
13
|
3
|
0
|
18
|
| 1979
|
0
|
1
|
0
|
0
|
0
|
1
|
| 1978
|
0
|
0
|
2
|
0
|
0
|
2
|
| 1977
|
0
|
0
|
7
|
0
|
0
|
7
|
| 1976
|
0
|
0
|
1
|
2
|
0
|
3
|
| 1975
|
0
|
0
|
0
|
2
|
1
|
3
|
| 1974
|
0
|
4
|
16
|
0
|
0
|
20
|
| 1973
|
0
|
1
|
1
|
0
|
0
|
2
|
| 1972
|
0
|
0
|
0
|
0
|
0
|
0
|
| 1971
|
0
|
2
|
1
|
0
|
1
|
4
|
| 1970
|
0
|
1
|
5
|
1
|
0
|
7
|
| 1969
|
0
|
1
|
3
|
0
|
0
|
4
|
| 1968
|
0
|
0
|
0
|
0
|
0
|
0
|
| 1967
|
1
|
0
|
0
|
0
|
0
|
1
|
| 1966
|
0
|
0
|
7
|
0
|
0
|
7
|
| 1965
|
0
|
0
|
0
|
0
|
0
|
0
|
| 1964
|
0
|
0
|
7
|
2
|
0
|
9
|
| 1963
|
0
|
2
|
0
|
2
|
0
|
4
|
| 1962
|
0
|
0
|
0
|
1
|
0
|
1
|
| 1961
|
0
|
2
|
1
|
0
|
0
|
3
|
| 1960
|
0
|
1
|
1
|
0
|
0
|
2
|
| 1959
|
0
|
0
|
0
|
0
|
0
|
0
|
| 1958
|
0
|
0
|
0
|
0
|
0
|
0
|
| 1957
|
0
|
0
|
7
|
2
|
0
|
9
|
| 1956
|
0
|
1
|
4
|
2
|
1
|
8
|
| 1955
|
0
|
0
|
5
|
5
|
1
|
11
|
| 1954
|
0
|
3
|
9
|
1
|
1
|
14
|
| 1953
|
0
|
5
|
5
|
1
|
2
|
13
|
| 1952
|
0
|
5
|
3
|
0
|
0
|
8
|
| 1951
|
0
|
0
|
0
|
2
|
0
|
2
|
| 1950
|
0
|
1
|
0
|
0
|
0
|
1
|
| 1949
|
0
|
0
|
0
|
0
|
0
|
0
|
| 1948
|
0
|
0
|
0
|
5
|
0
|
5
|
| 1947
|
0
|
0
|
3
|
16
|
3
|
22
|
| 1946
|
0
|
2
|
1
|
0
|
0
|
3
|
| 1945
|
0
|
0
|
2
|
0
|
0
|
2
|
| 1944
|
0
|
1
|
0
|
2
|
0
|
3
|
| 1943
|
0
|
3
|
2
|
5
|
0
|
10
|
| 1942
|
0
|
0
|
5
|
1
|
0
|
6
|
| 1941
|
0
|
0
|
8
|
5
|
0
|
13
|
| 1940
|
0
|
2
|
14
|
1
|
2
|
19
|
| 1939
|
0
|
0
|
7
|
0
|
3
|
10
|
| 1938
|
0
|
0
|
6
|
6
|
0
|
12
|
| 1937
|
0
|
4
|
4
|
8
|
0
|
16
|
| 1936
|
0
|
4
|
19
|
16
|
2
|
41
|
| 1935
|
0
|
0
|
11
|
8
|
0
|
19
|
| 1934
|
3
|
8
|
21
|
7
|
0
|
39
|
| 1933
|
0
|
6
|
2
|
1
|
0
|
9
|
| 1932
|
0
|
0
|
3
|
0
|
0
|
3
|
| 1931
|
0
|
5
|
4
|
0
|
6
|
15
|
| 1930
|
0
|
1
|
13
|
3
|
0
|
17
|
| 1929
|
0
|
0
|
0
|
2
|
0
|
2
|
| 1928
|
0
|
0
|
1
|
0
|
0
|
1
|
| 1927
|
0
|
0
|
1
|
0
|
0
|
1
|
| 1926
|
0
|
2
|
4
|
2
|
0
|
8
|
| 1925
|
0
|
0
|
3
|
0
|
0
|
3
|
| 1924
|
0
|
0
|
0
|
3
|
0
|
3
|
| 1923
|
0
|
0
|
0
|
0
|
0
|
0
|
| 1922
|
0
|
1
|
0
|
2
|
4
|
7
|
| 1921
|
0
|
1
|
0
|
4
|
1
|
6
|
| 1920
|
0
|
0
|
0
|
0
|
0
|
0
|
| 1919
|
0
|
0
|
7
|
1
|
0
|
8
|
| 1918
|
0
|
7
|
1
|
9
|
0
|
17
|
| 1917
|
0
|
1
|
5
|
1
|
0
|
7
|
| 1916
|
0
|
0
|
3
|
2
|
0
|
5
|
| 1915
|
0
|
0
|
0
|
0
|
0
|
0
|
| 1914
|
0
|
0
|
3
|
3
|
1
|
7
|
| 1913
|
0
|
0
|
9
|
15
|
5
|
29
|
| 1912
|
0
|
0
|
4
|
2
|
0
|
6
|
| 1911
|
0
|
7
|
5
|
3
|
0
|
15
|
| 1910
|
0
|
0
|
2
|
0
|
0
|
2
|
| 1909
|
0
|
0
|
0
|
2
|
0
|
2
|
| 1908
|
0
|
0
|
0
|
0
|
0
|
0
|
| 1907
|
0
|
0
|
1
|
0
|
0
|
1
|
| 1906
|
0
|
0
|
0
|
0
|
0
|
0
|
| 1905
|
0
|
0
|
0
|
0
|
0
|
0
|
| 1904
|
0
|
0
|
0
|
0
|
0
|
0
|
| 1903
|
0
|
0
|
0
|
0
|
0
|
0
|
| 1902
|
0
|
0
|
0
|
0
|
0
|
0
|
| 1901
|
0
|
3
|
21
|
1
|
0
|
25
|
| 1900
|
0
|
0
|
1
|
0
|
0
|
1
|
| 1899
|
0
|
0
|
0
|
0
|
2
|
2
|
| 1898
|
0
|
0
|
0
|
1
|
0
|
1
|
| 1897
|
0
|
1
|
2
|
0
|
1
|
4
|
| 1896
|
0
|
0
|
0
|
0
|
0
|
0
|
| 1895
|
0
|
0
|
3
|
0
|
2
|
5
|
| 1894
|
0
|
0
|
1
|
1
|
0
|
2
|
| 1893
|
0
|
0
|
0
|
0
|
0
|
0
|
| 1892
|
0
|
0
|
2
|
0
|
0
|
2
|
| 1891
|
0
|
0
|
0
|
0
|
0
|
0
|
| 1890
|
0
|
0
|
5
|
0
|
0
|
5
|
| 1889
|
0
|
0
|
0
|
0
|
0
|
0
|
| 1888
|
0
|
0
|
1
|
1
|
0
|
2
|
| 1887
|
0
|
0
|
1
|
1
|
0
|
2
|
| TOTAL
|
4 |
107 |
375 |
219 |
43 |
748 |
Percent
of total |
0.5% |
14.3% |
50.1% |
29.3% |
5.7% |
100% |
| Year
|
May
Number of days
|
June
Number of days
|
July
Number of days
|
August
Number of days
|
September
Number of days
|
Annual
Number of days
|
All of the above data are the Official National Weather Service data for Lincoln, NE.
These data were acquired from the High Plains
Regional Climate Center