
January 2010
Lincoln,
Nebraska Daily Climate Data
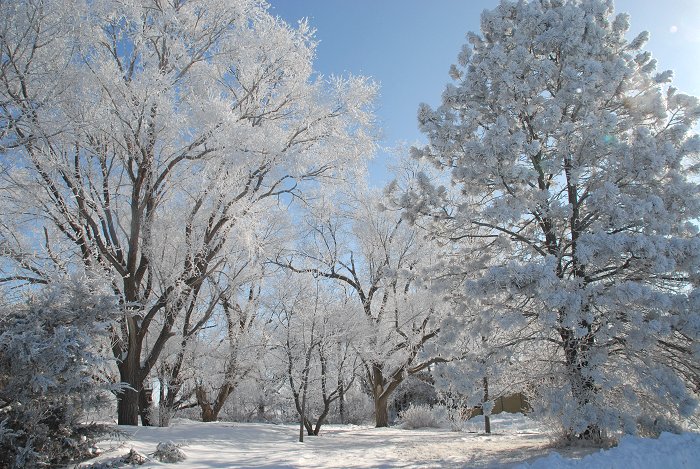
January 9, 2010. A Winter Wonderland in
Lincoln, NE.
©Ken
Dewey, UNL, SNR.
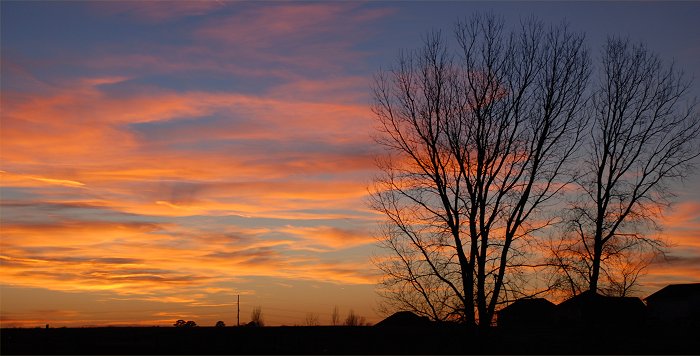
More January 9, 2010 photos: Winter Scenery, Lincoln/Lancaster County, January 9, 2010
Also see our January 2010 Photo Gallery and our entire photo gallery
Lincoln Live Weather Watching Web Cams
NEW: Year 2009 Global Temperatures 5th Warmest on Record
NEW: January 9, 2010: All Lower 48 states have subfreezing temperatures
NEW: Satellite Images Showing Snow Cover on January 9, 2010
Last month's Data: (December 2009)
|
Central Plains Severe Weather
Symposium and Family Weatherfest Saturday, March 27, 2010
Event Website: Click Here |
 |
Monthly Snowfall 2009-2010
| . | . | |||||||
Nebraska Winter Weather Forecast Page
NOTE: All data on this page are from the National Weather Service and HPRCC data archives.
Note: all low temperatures of 0o F or lower are in BLUE.
| January | PREC |
MAX |
MIN |
MAX |
MIN |
Mean |
|||||||||
| 13 | -5 | 4 | -19 | T | 61 | ||||||||||
| January 2 | 4 | -9 | -2 | -25 | 0.14 | 67 | |||||||||
| 7 | 3 | 5 | -17 | 0.08 | 60 | 1.1 | |||||||||
| 11 | -15 | -2 | -24 | 0.02 | 67 | 0.3 | |||||||||
| 13 | -13 | 0 | -22 | 0.00 | 65 | ||||||||||
| 18 | 6 | 12 | -10 | 0.25 | 53 | 3.1 | |||||||||
| 6 | -4 | 1 | -21 | T | 64 | T | |||||||||
| 3 | -9 | -3 | -25 | T | 68 | T | |||||||||
| January 9 | 7 | -13 | -3 | -25 | 0.00 | 68 | |||||||||
| 26 | -3 | 12 | -10 | 0.00 | 53 | ||||||||||
| 28 | 5 | 17 | -5 | T | 48 | T | |||||||||
| 27 | 2 | 15 | -7 | 0.00 | 50 | ||||||||||
| 39 | 19 | 29 | +7 | 0.00 | 36 | ||||||||||
| 38 | 15 | 27 | +5 | 0.00 | 38 | ||||||||||
| 28 | 17 | 23 | +1 | T | 42 | ||||||||||
| January 16 | 36 | 12 | 24 | +2 | 0.00 | 41 | |||||||||
| 32 | 29 | 31 | +9 | 0.00 | 34 | ||||||||||
| 29 | 26 | 28 | +6 | 0.00 | 37 | ||||||||||
| 34 | 27 | 31 | +9 | 0.17 | 34 | T | |||||||||
| 34 | 32 | 33 | +11 | 0.11 | 32 | ||||||||||
| 34 | 32 | 33 | +11 | 0.00 | 32 | ||||||||||
| 40 | 30 | 35 | +12 | T | 30 | ||||||||||
| January 23 | 43 | 34 | 39 | +17 | 0.03 | 26 | |||||||||
| 36 | 27 | 32 | +9 | 0.02 | 33 | 0.2 | |||||||||
| 27 | 19 | 23 | 0 | T | 42 | ||||||||||
| 26 | 18 | 22 | -1 | T | 43 | ||||||||||
| 31 | 19 | 25 | +2 | 0.00 | 40 | ||||||||||
| Thursday | 20 | 7 | 14 | -9 | 0.00 | 51 | |||||||||
| January 29 | 24 | 9 | 17 | -6 | 0.00 | 0.52 | 66 | -18 | 48 | 0 | 34 | 13 | 23 | ||
| 33 | 8 | 21 | -3 | 0.00 | 44 | ||||||||||
| 28 | 14 | 21 | -3 | 0.00 | 44 | ||||||||||
PREC |
MAX |
MIN |
MAX |
MIN |
Mean |
||||||||||
| 0.82 | 1451 | 7.1 | |||||||||||||
|
DEPARTURE
|
-8.2 | -0.6 | -4.4 | +0.15 | +123 | +2.0 |
Warmest recorded JANUARY temperature, 73 F, January 10, 1990. Coldest recorded JANUARY temperature, -33 F, January 12, 1974 Most JANUARY Snowfall: 23.0 inches, 1915. Least January Snowfall: Trace (flurries and not measurable), 3 of the last 112 years (1900, 1986, 2006). AVERAGE AND TOTAL are JANUARY 2010. NORMAL is the 1971-2000 Standard Normals. DEPARTURE is JANUARY 2010. Average measured against 1971-2000 normals. MAX = Observed Maximum and MIN = Observed Minimum temperatures in deg. F.. MEAN = Observed Mean Daily temperature in deg. F.. DEP = Departure from normal ( __ = below normal, + above normal) in deg. F.. PCPN = Observed daily precipitation (midnight to midnight, CST), in inches. REC PREC = Record daily precipitation amount in inches. REC MAX = Record Maximum temperature in deg. F. REC MIN = Record Minimum temperature in deg. F.. HDD = heating degree day units (base of 65 degrees). CDD = cooling degree day units (base of 65 degrees). AVG MAX = Daily Normal High Temperature (1971-2000 normals). AVG MIN = Daily Normal Low Temperature (1971-2000 normals). AVG MEAN = Daily Normal Mean Temperature (1971-2000 normals). SNOW = Snowfall in inches. |
|
School of Natural Resources  |