Year 2008 Precipitation (in inches): compared to normal: red above normal, blue below normal
| 3.80 | 4.12 | 8.59 | 3.58 | ||||||||||
ALL August 2008 high temperatures of 90 F or higher are in RED.
| 2008 | PREC |
MAX |
MIN |
MAX |
MIN |
MEAN |
||||||||
| Fri. | Aug. 1 | 93 | 71 | 82 | +4 | 0.00 | 17 | |||||||
| Sat. | Aug. 2 | 99 | 73 | 86 | +8 | 0.00 | 21 | |||||||
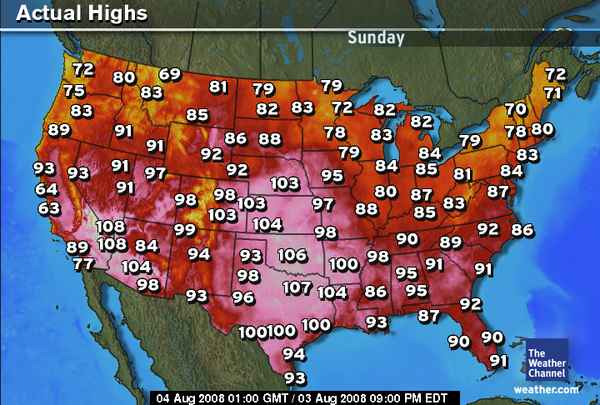
| Sun. | Aug. 3 | 102 | 70 | 86 | +8 | 0.00 | 21 | |||||||
| Aug. 4 | 93 | 75 | 84 | +6 | 0.00 | 19 | ||||||||
| Tue. | Aug. 5 | 85 | 65 | 75 | -2 | T | 10 | |||||||
| Wed. | Aug. 6 | 86 | 63 | 75 | -2 | 0.00 | 10 | |||||||
| Thurs. | Aug. 7 | 90 | 60 | 75 | -2 | 0.00 | 10 | |||||||
| Fri. | Aug. 8 | 90 | 61 | 76 | -1 | 0.00 | 11 | |||||||
| Sat. | Aug. 9 | 81 | 66 | 74 | -3 | 0.24 | 9 | |||||||
| Sun. | Aug. 10 | 88 | 59 | 74 | -3 | 0.26 | 9 | |||||||
| Aug. 11 | 84 | 65 | 75 | -2 | 0.40 | 10 | ||||||||
| Tue. | Aug. 12 | 87 | 63 | 75 | -1 | 0.02 | 10 | |||||||
| Wed. | Aug. 13 | 91 | 65 | 78 | +2 | T | 13 | |||||||
| Thurs. | Aug. 14 | 86 | 66 | 76 | 0 | 0.00 | 11 | |||||||
| Fri. | Aug. 15 | 84 | 62 | 73 | -3 | 0.00 | 8 | |||||||
| Sat. | Aug. 16 | 84 | 58 | 71 | -5 | 0.00 | 6 | |||||||
| Sun. | Aug. 17 | 86 | 55 | 71 |  |
0.00 | 6 | |||||||
| Aug. 18 | 89 | 60 | 75 | 0 | 0.00 | 10 | ||||||||
| Tue. | Aug. 19 | 88 | 60 | 74 | -1 | 0.00 | 9 | |||||||
| Wed. | Aug. 20 | 87 | 57 | 72 | -3 | T | 7 | |||||||
| Thurs. | Aug. 21 | 84 | 66 | 75 | 0 | 0.00 | 10 | |||||||
| Fri. | Aug. 22 | 95 | 70 | 83 | +9 | 0.00 | 18 | |||||||
| Sat. | Aug. 23 | 83 | 63 | 73 | -1 | 0.00 | 8 | |||||||
| Sun. | Aug. 24 | 83 | 61 | 72 | -2 | 0.46 | 7 | |||||||
| Aug. 25 | 83 | 56 | 70 | -3 | 0.00 | 5 | ||||||||
| Tue. | Aug. 26 | 82 | 59 | 71 | -2 | 0.00 | 6 | |||||||
| Wed. | Aug. 27 | 87 | 64 | 76 | -2 | 0.40 | 11 | |||||||
| Thurs. | Aug. 27 | 90 | 57 | 74 | +1 | 0.00 | 9 | |||||||
| Aug. 28 | 89 | 50 | 70 | -2 | 0.00 | 5 | ||||||||
| Aug. 29 | 91 | 54 | 73 | +1 | 0.00 | 8 | ||||||||
| Aug. 30 | 93 | 69 | 81 | +9 | 0.00 | 16 | ||||||||
| 2008 | ||||||||||||||
| 1.78 | 330 | |||||||||||||
| 88.2 | 62.7 | 75.4 | ||||||||||||
| +1.1 | -1.0 | 0.0 | -1.57 | +15 |
Hottest recorded August temperature, 110 F, August 8, 1934 & August 18, 1936. Coldest recorded August temperature, 39 F, August 20, 1950. NORMAL (Norm) is the 1971-2000 Standard Normals. DEPARTURE is AUGUST 2008 Average measured against 1971-2000 normals. MAX = Observed Maximum and MIN = Observed Minimum temperatures. MEAN = Observed Mean Daily temperature. DEP = Departure from normal ( _ = below normal, + above normal). PREC = Observed daily precipitation (midnight to midnight, CST) in inches. REC PREC = Record daily amount of precipitation in inches. REC MAX = Record maximum temperature in deg. F. REC MIN = Record Minimum temperature in deg. F. HDD = heating degree day units (base of 65 degrees). CDD = cooling degree day units (base of 65 degrees). Norm MAX = Daily Normal High Temperature (1971-2000 normals). Norm MIN = Daily Normal Low Temperature (1971-2000 normals). Norm MEAN = Daily Normal Mean Temperature (1971-2000 normals). |
UNL
University of Nebraska-Lincoln
Applied Climate Sciences Group
School of Natural Resources