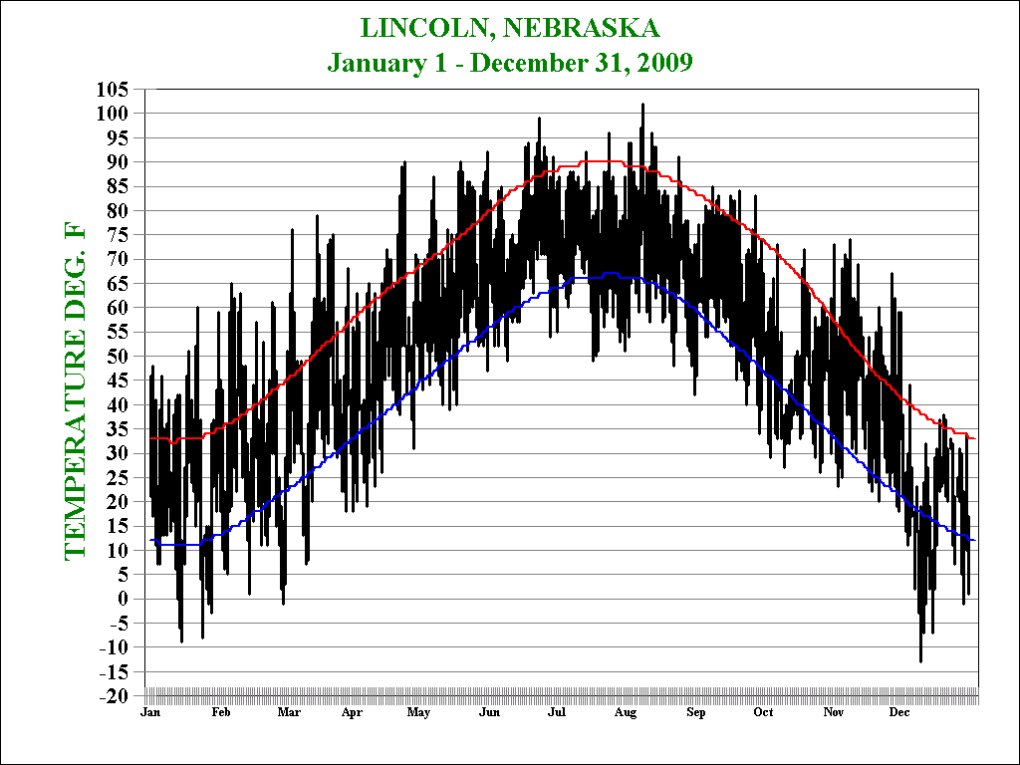
Lincoln, Nebraska, Observed High and Low Temperatures Compared to Normal
The red line is the normal high and the blue line is the normal low.
The top of each vertical bar is the high for the day and the bottom of each vertical bar is the low for the day.
|
School of Natural Resources  |